Riemannova hypoteza - platnost_3_diel
Úvod
Tento diel je voľným pokračovaním na články (Riemannova hypotéza – platnosť (1. diel), Riemannova hypotéza – dodatok 2, Guy - Robin index). Bez pochopenia problematiky predchádzajúcich dielov nebude tento diel pre čitateľa dostatočne zrozumiteľný.
Podarilo sa mi vytvoriť program na preverenie Riemannovej hypotézy pre dostatočne veľké čísla. Z toho plynú určité konzekvencie. Z analýzy vyplýva, že Riemannová hypotéza z výsledkov zatiaľ ostáva sporná. Tento diel nebude obsahovať presný matematický dôkaz (v zmysle zápisov, formy). Tento diel aj upresní nepresnosti, či chyby z predchádzajúcich dielov o platnosti Riemannovej hypotézy.
Výpočet vychádza z Robin theorem
https://mathworld.wolfram.com/RobinsTheorem.html
Platnosť Riemannovej hypotézy - program
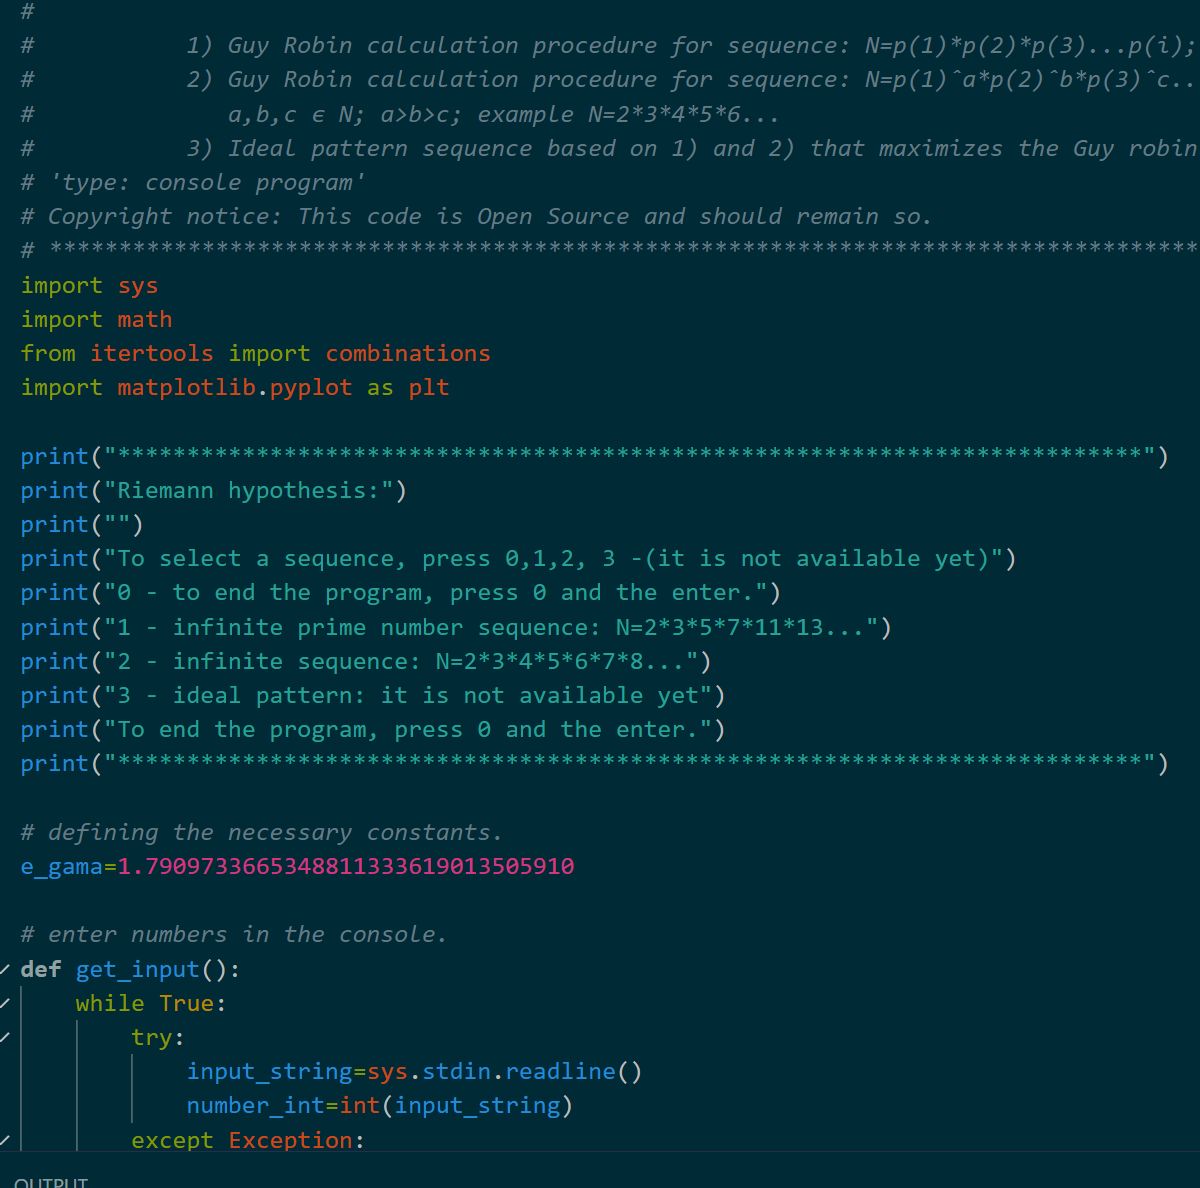
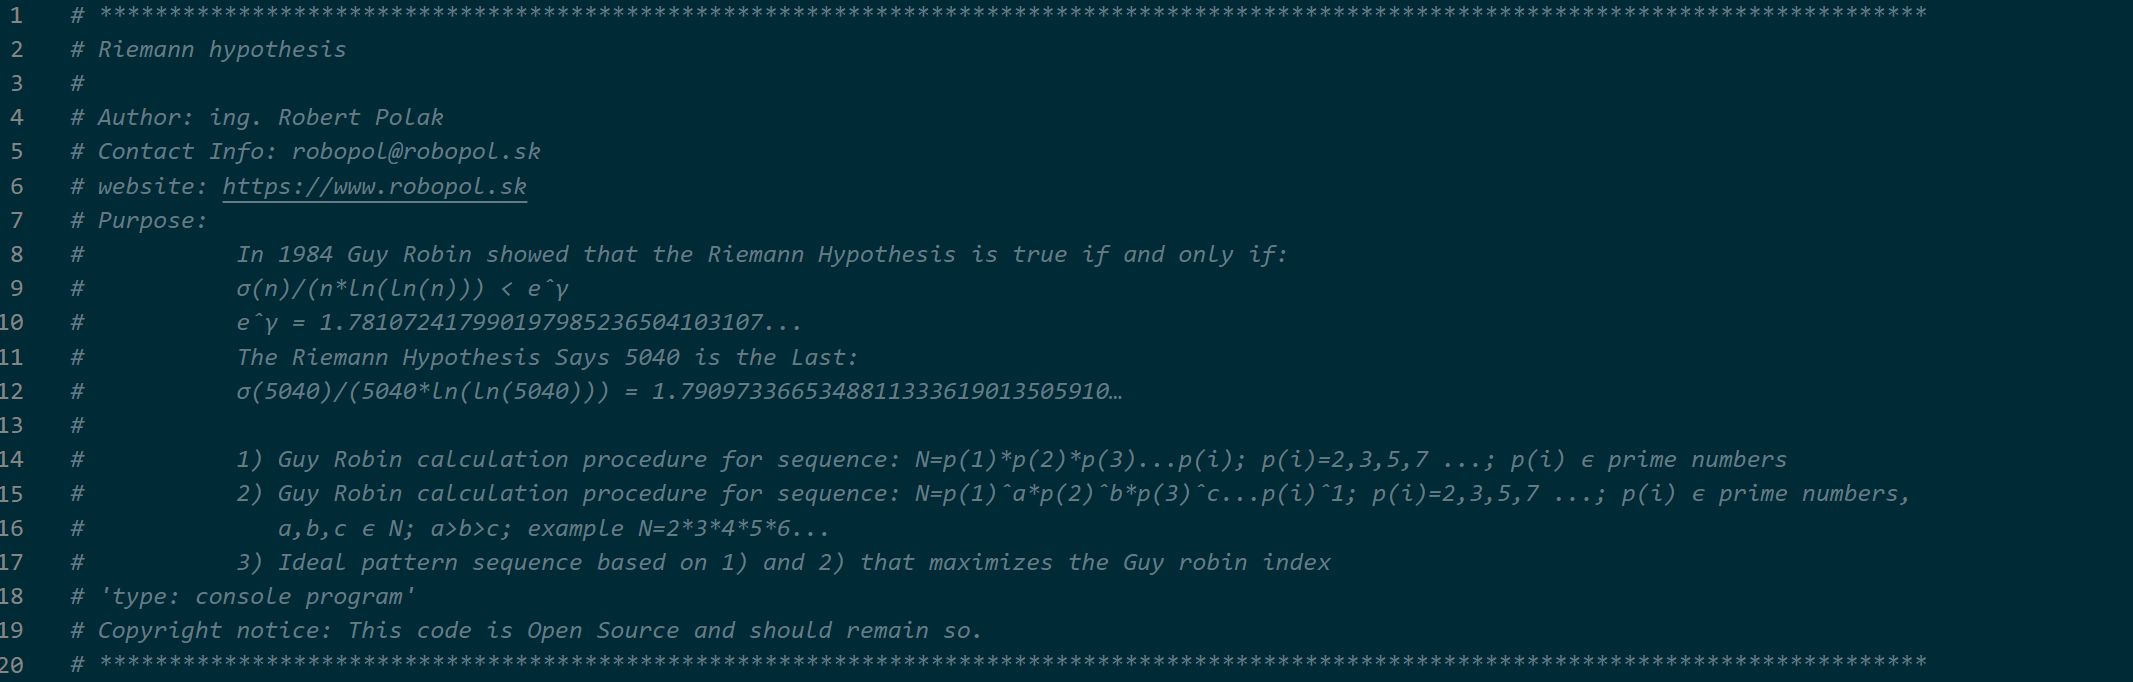
Obr. 1 Ukážka zdrojového kódu programu.
Verzia č.2:
download súboru v Pythone: riemanm_hypothesis_1.py
Pozrieť kód vo formáte ".txt":
riemanm_hypothesis_1.txt
alebo stiahnuť kód z GitHub:
riemanm_hypothesis_1.py
Popis: Algoritmus obsahuje výpočet Guy Robin indexu pre rôzne sekvencie, postupnosti, pre potvrdenie platnosti Riemannovej hypotézy.
Postupnosť prvočísiel v súčine za sebou
1) Guy Robin calculation procedure for sequence: N=p(1)*p(2)*p(3)...p(i); p(i)=2,3,5,7 ...; p(i) ϵ prime numbers.
Výsledky:
- zadaná postupnosť do N= 25 (viď. obr.2).
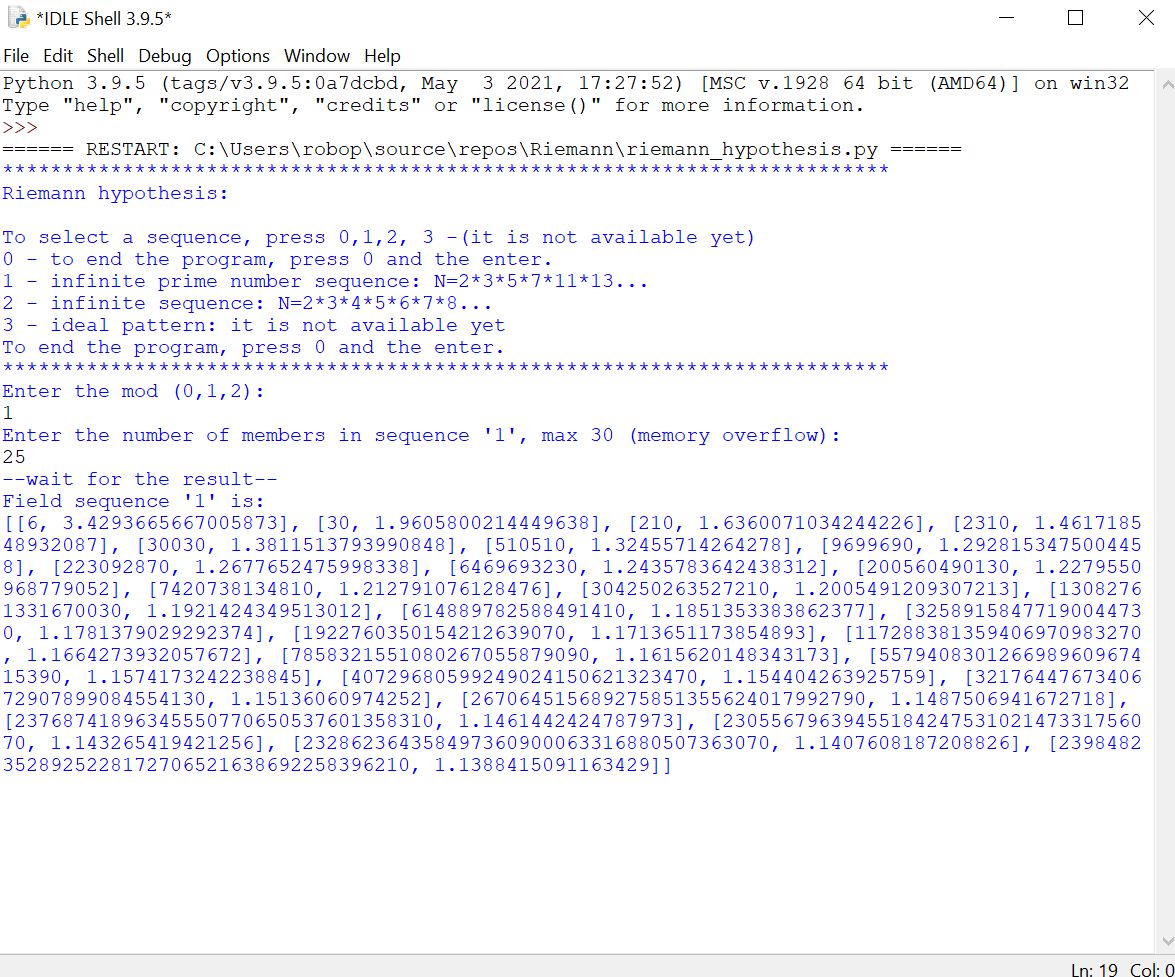
obr. 2 Sekvencia postupnosti "1".
graf priebehu:
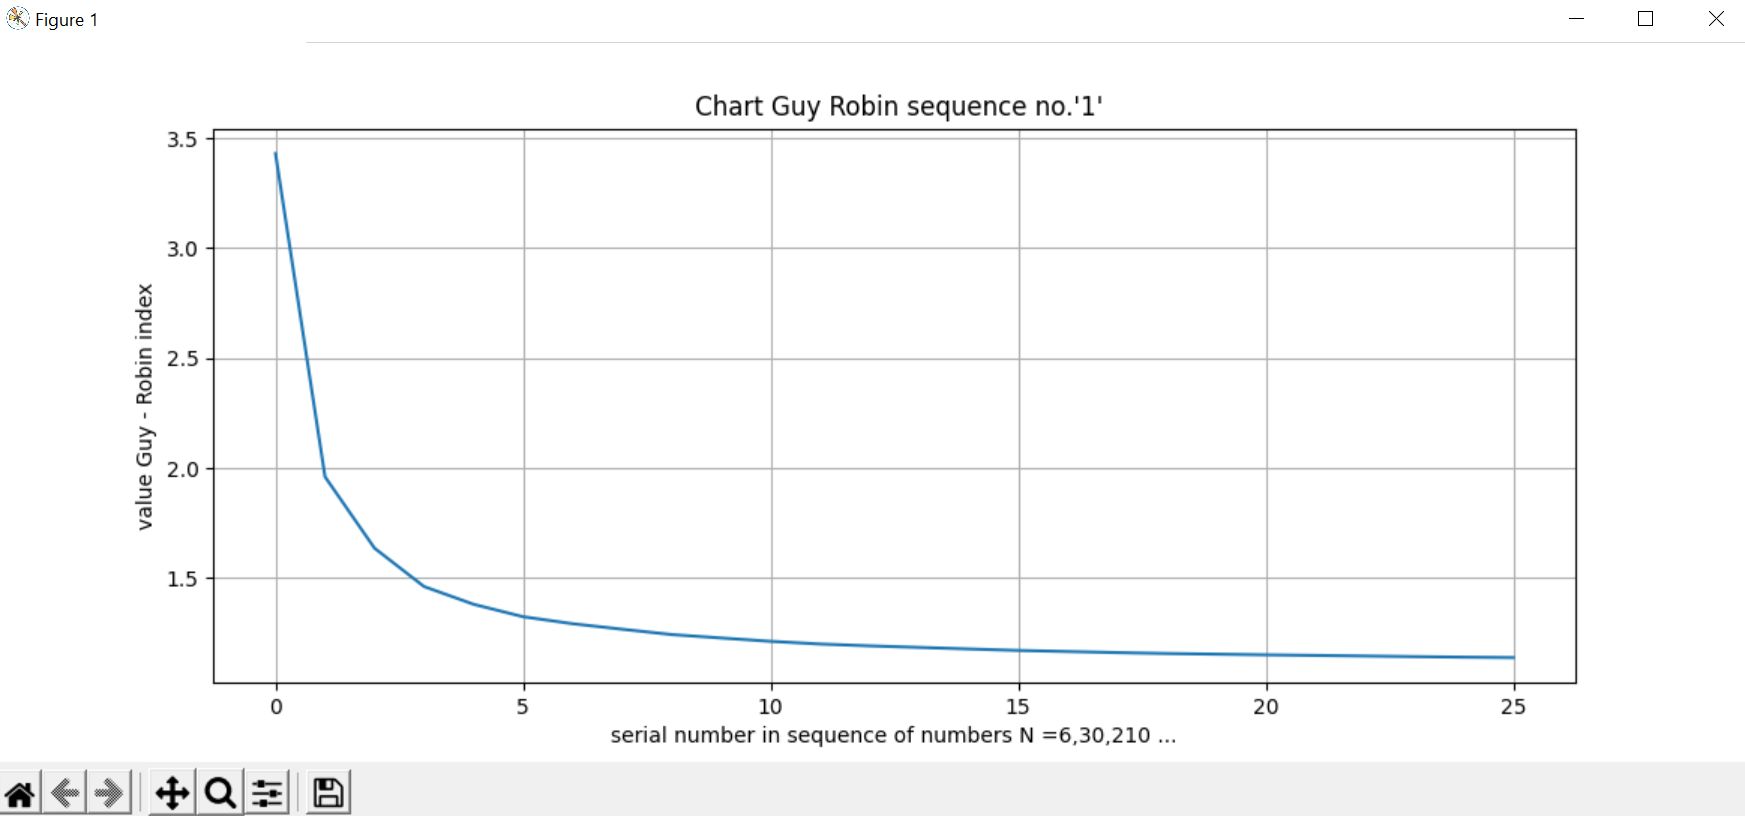 obr.3
Graf priebehu postupnosti "1".
obr.3
Graf priebehu postupnosti "1".
Postupnosť prirodzených čísiel v súčine za sebou
2) Guy Robin calculation procedure for sequence: N=p(1)ˆa*p(2)ˆb*p(3)ˆc...p(i)ˆ1; p(i)=2,3,5,7 ...; p(i) ϵ prime numbers, a,b,c ϵ N; a>b>c; example N=2*3*4*5*6...
Výsledky:
- zadaná postupnosť do N= 100 (viď. odkaz: sequence_2_100_.txt).
graf priebehu:
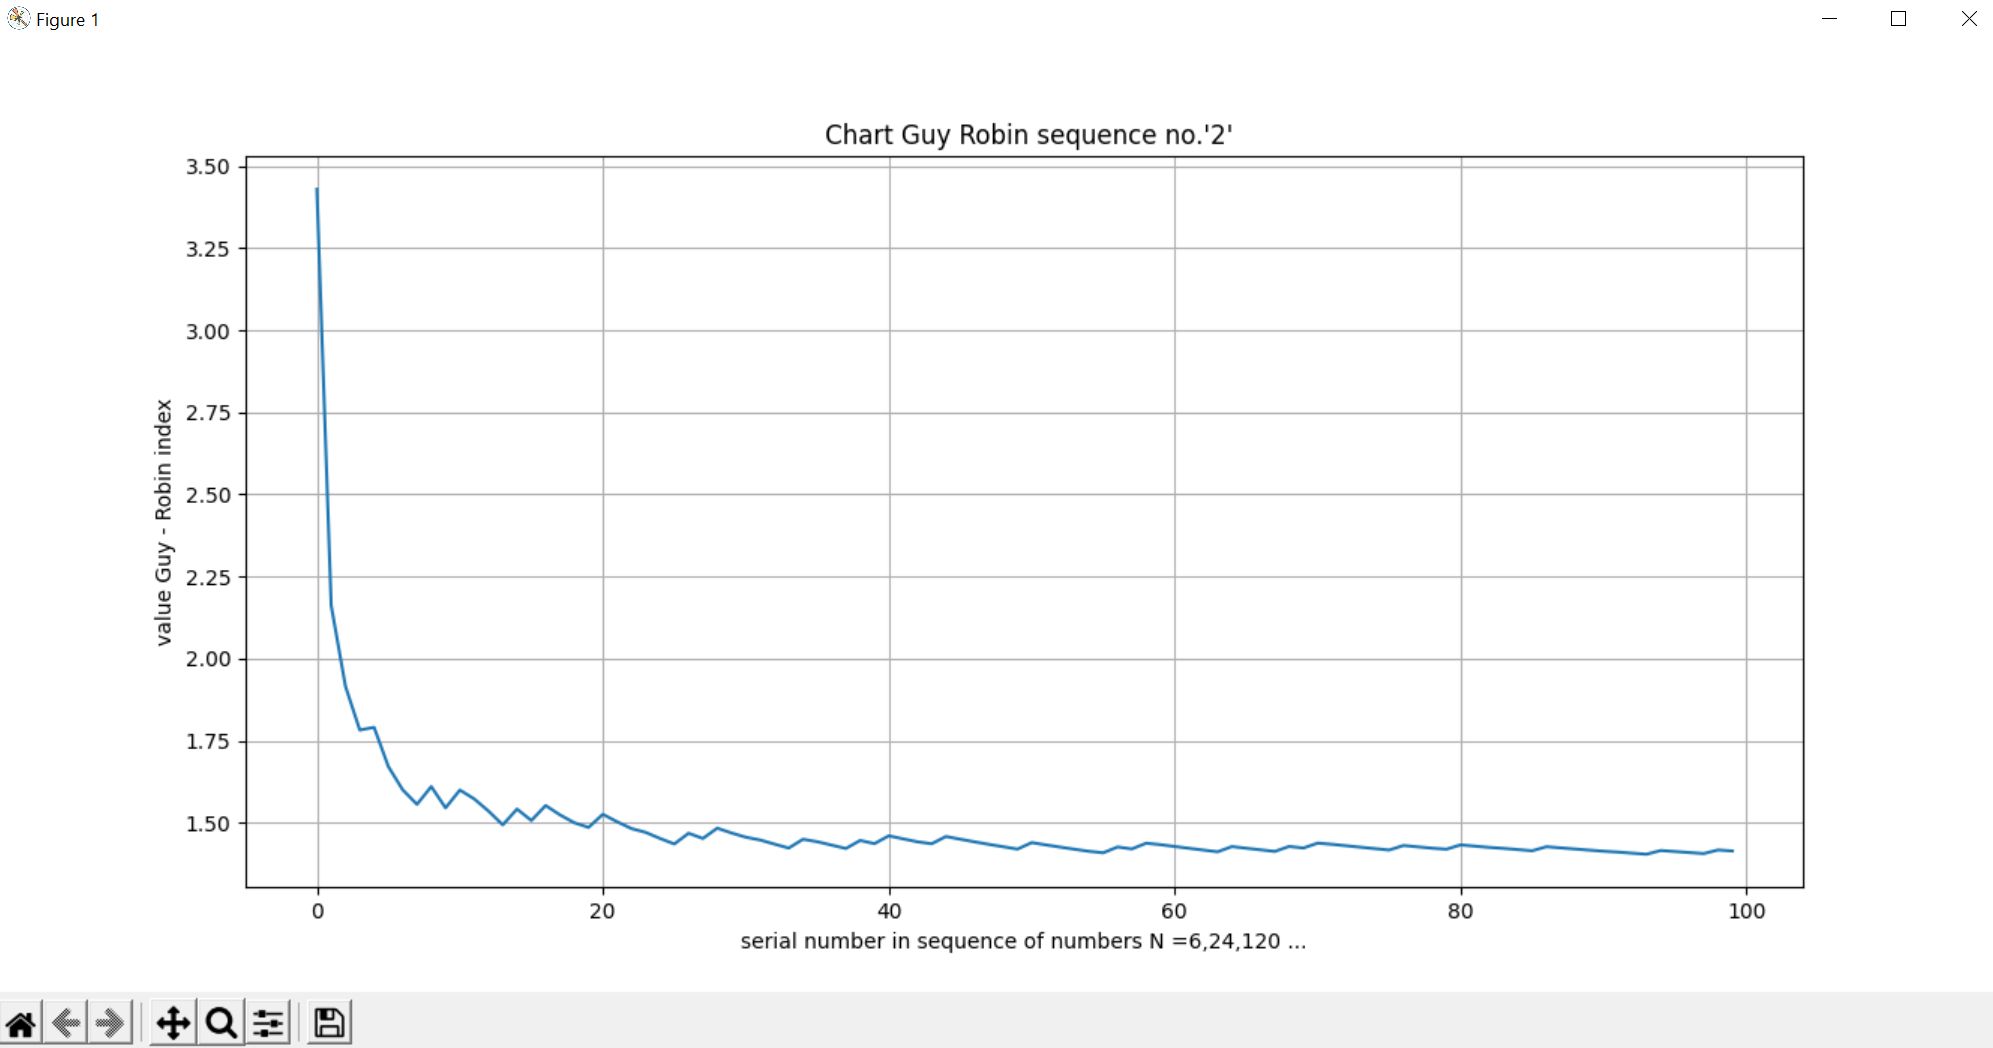 obr.4
Graf priebehu postupnosti "2".
obr.4
Graf priebehu postupnosti "2".
Ideálny pattern
Tento ideálny vzor, sekvencia je úplne naprogramovaná a čiastočne optimalizovaná. Tento vzor vznikne najvýhodnejšou kombináciou predchádzajúcich dvoch vzorov.
V diely platnosť Riemanovej hypotézy -2 diel je chyba, že existujú dve takéto ideálne sekvencie. No existuje len jedna.
3) Guy Robin calculation procedure for ideal sequence.
Výsledky:
- zadaná postupnosť do N= 220, (viď. odkaz: sequence_3_200_.txt).
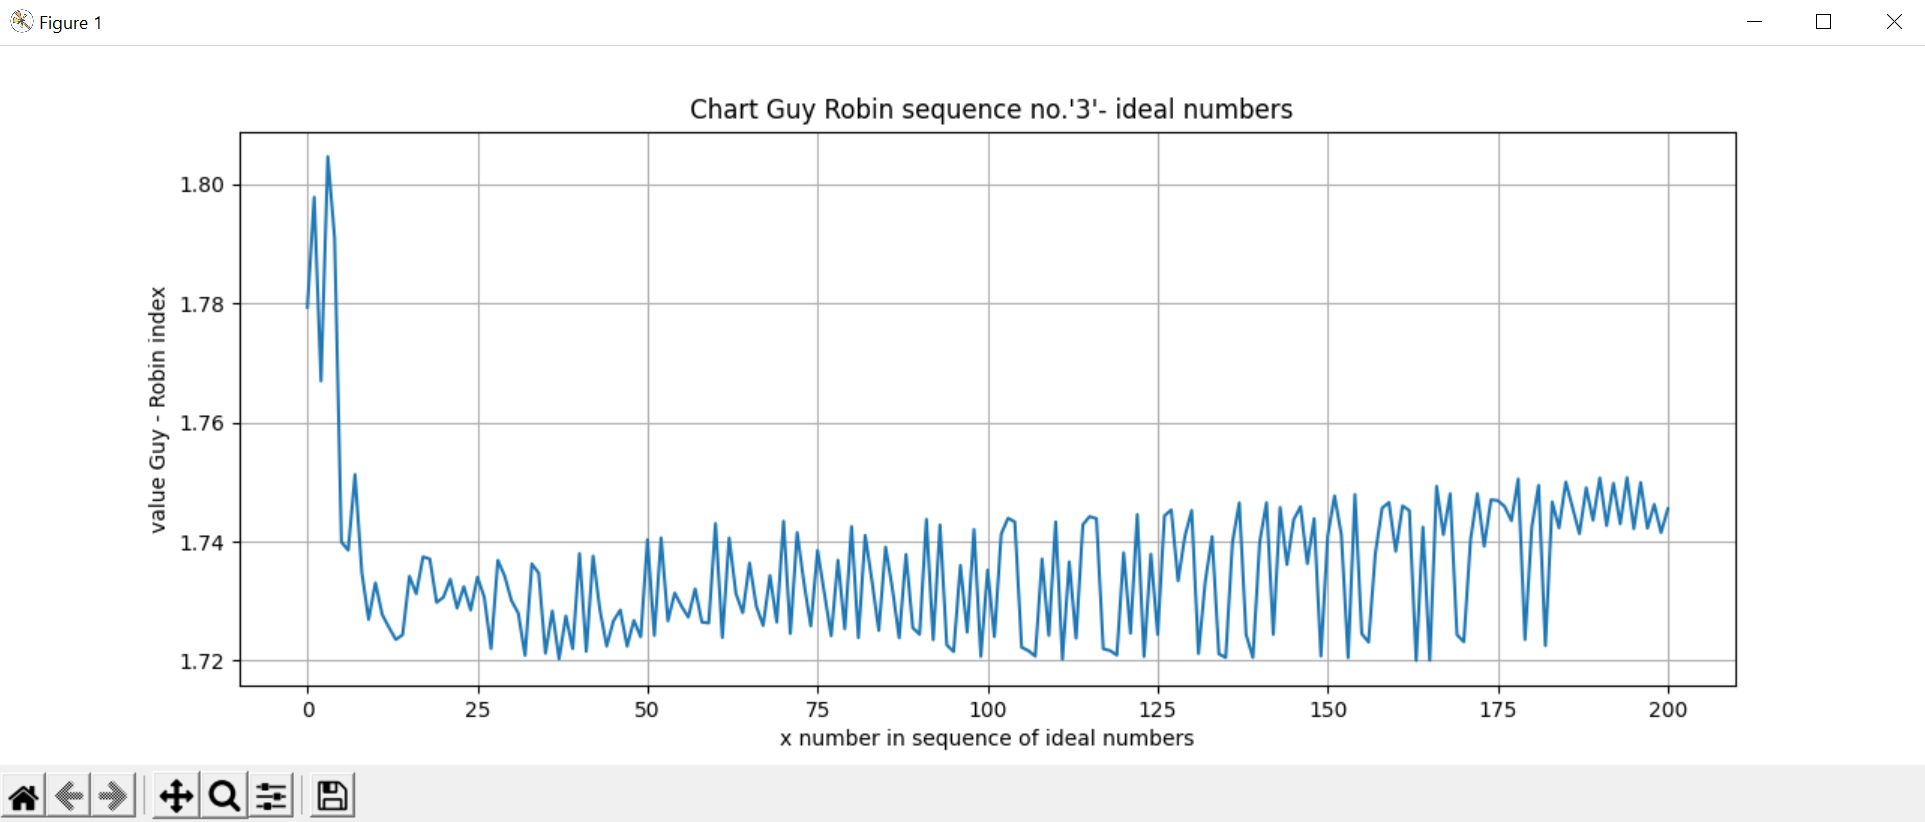
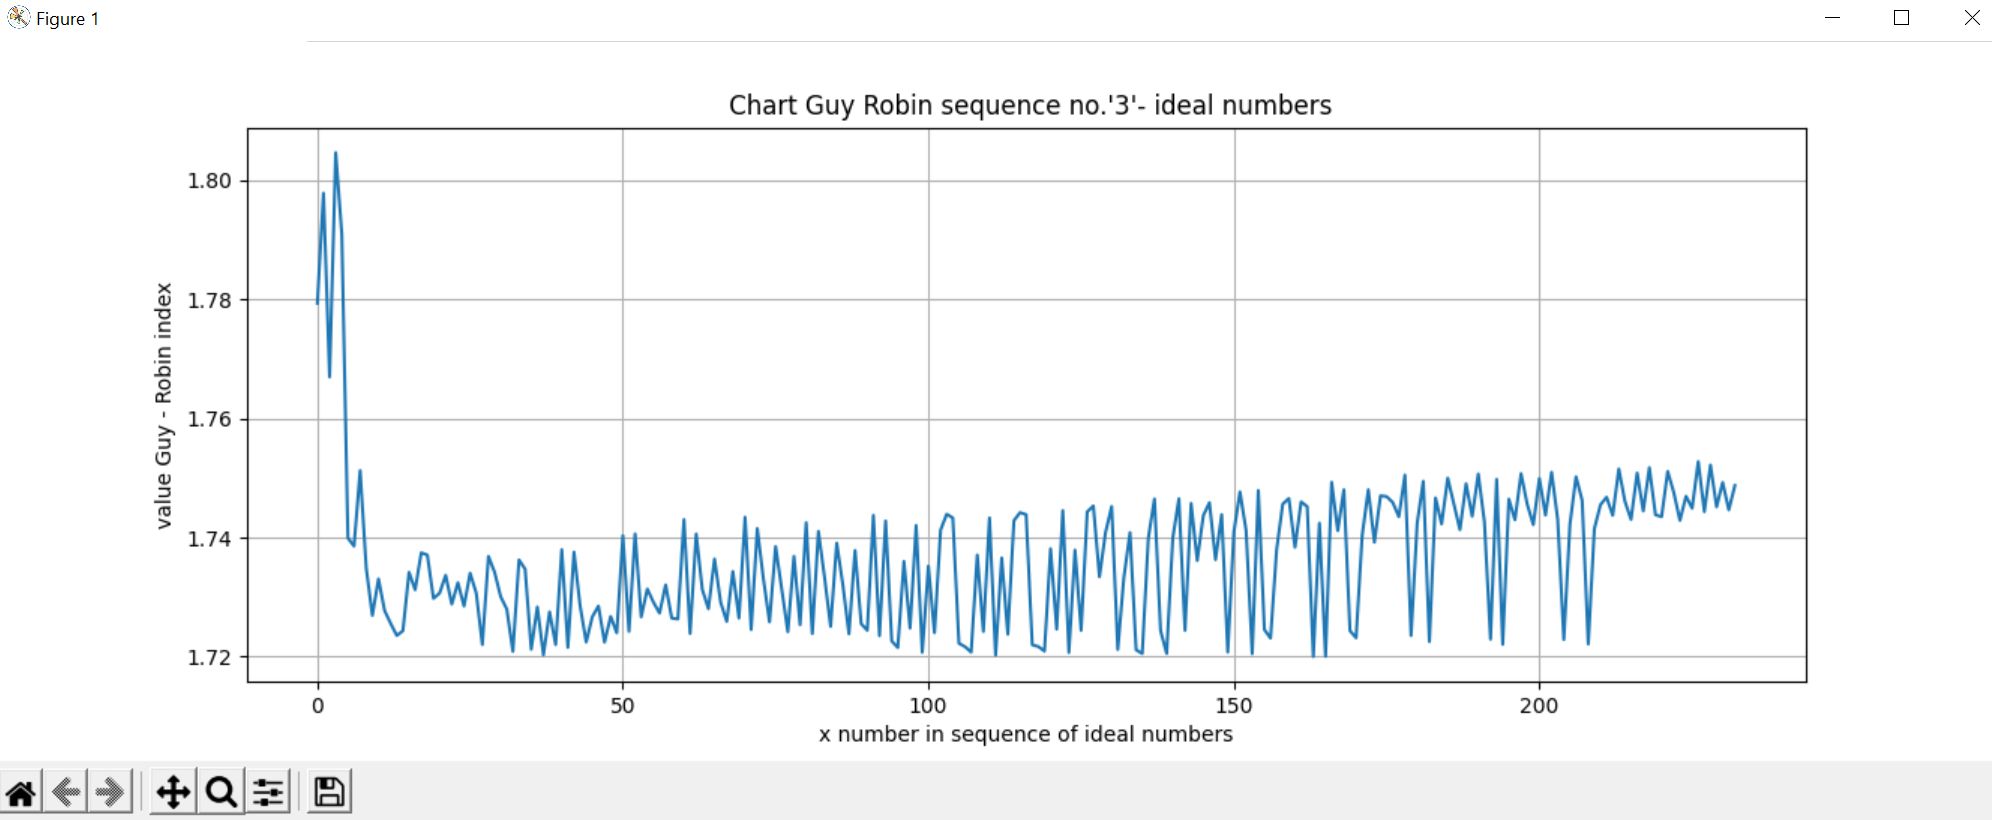
Obr.5-6 Ideálna sekvencia, postupnosť čísiel - "3".
Posledný člen má hodnotu:
[211584826248507963091268461931364601928913607488000,1.7487485890698855]
Vyhodnotenie:
Z vyhodnotenej vzorky ideálnej sekvencie čísiel sa zdá práve, že
priebeh má od istého momentu, čísla stúpajúci charakter. To je vcelku
prekvapujúce.
Limita funkcie, postupnosti
Dôležitý záver je tento: Dve uvedené sekvencie "1" a "2" majú prirodzený pokles pre n => spejúc do nekonečna. Toto preukazujú dáta a grafy. Ideálny pattern, sekvencia je však LEN najvýhodnejšia kombinácia sekvencie "1" a "2". Ten ideálny pattern maximalizuje Gay Robin index, teda sa jedná o čísla, ktoré majú tie najvyššie hodnoty.
Program potvrdil tento pokles na určitej zrátateľnej množine pre postupnosť (1),(2).
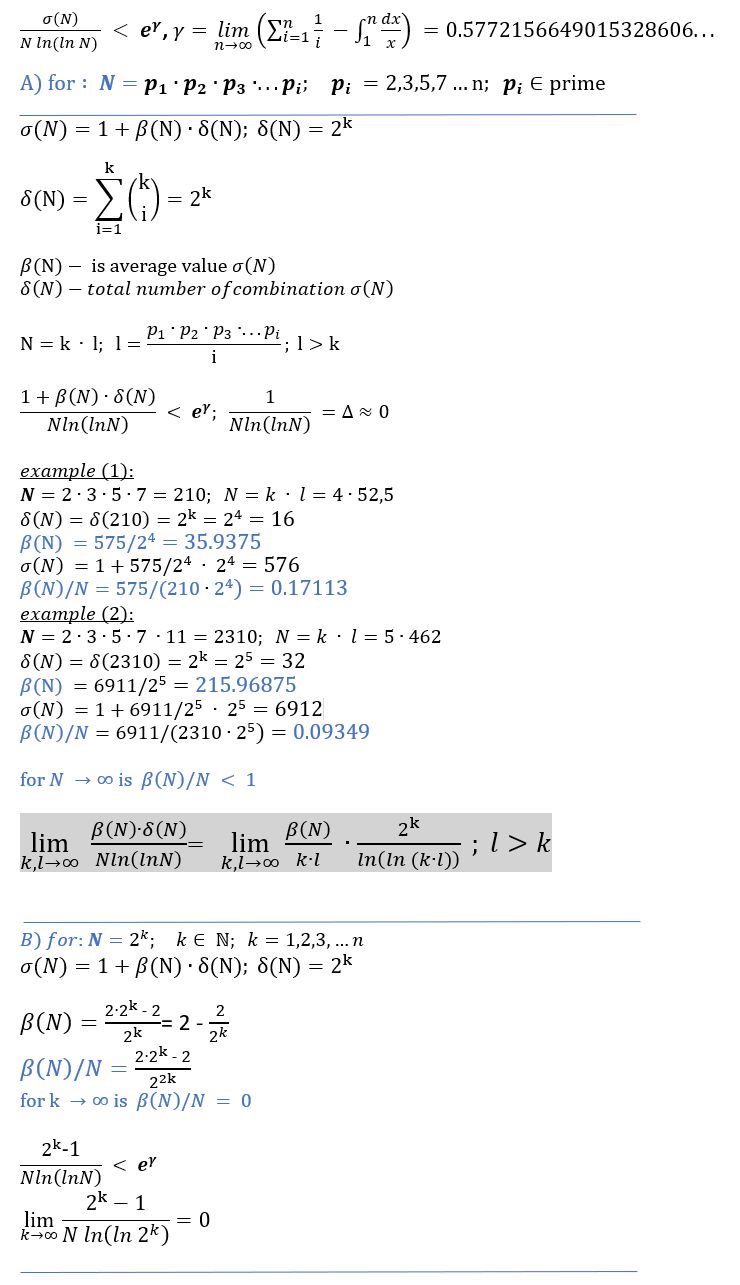
Vlastnosti tejto množiny, teda výpočet sigmy (všetkých kombinácii deliteľov) platia pre n =>
infinity, nijak sa tieto vlastnosti smerom do nekonečna nemenia, menovateľ vo vzťahu:
σ(n)/(n*ln(ln(n))) < eˆγ
eˆγ = 1.781072417990197985236504103107... sa taktiež nijak
nemení.
Nemôže teda dôjsť z poklesu na nárast Guy Robin indexu smerom k nekonečnu pre (1), (2).
Mohli by sme isť aj na to čiste matematicky:
Výsledok limity závisí od beta(N). Teda bez toho, aby sme ju presne aproximovali nemôžeme vedieť, či limita je nula, či voľajaké kladné číslo.
Záver
Pre postupnosť (3) - ideálny pattern však výsledky neukazujú jednoznačne na klesajúcu funkciu! Teda z výpočtového výkonu bežných pc sa nedá povedať nič také ako o sekvencii (1) a (2). Problém je ten, že aj sekvencia (3) môže vykazovať oscilujúci charakter pri väčších číslach (no nemusí).
Taká hrubá aproximácia je uvedená na priloženom obrázku č.7. Môžu nastať tieto prípady:
A)
Niekde v 2-3 násobku 220-240 bodov pretne kritickú hranicu.
B) Bude sa vývoj približovať ku
kritickej hranici, no nikdy ju nedosiahne (zaoblená krivka).
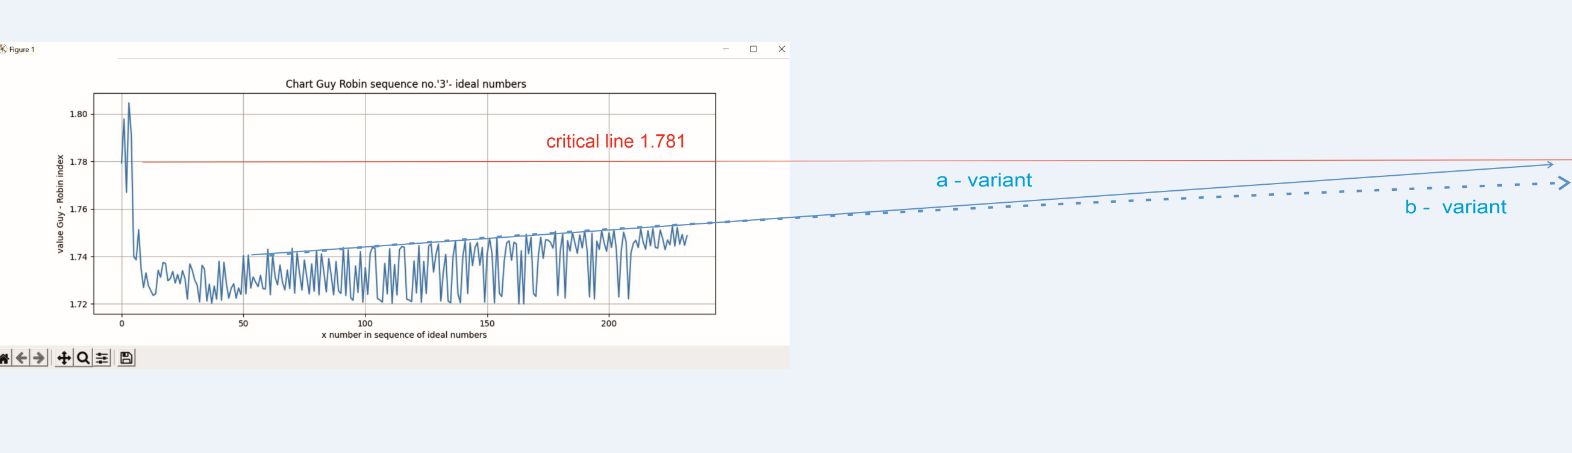 Obr.7
Aproximovaný vývoj indexu
Obr.7
Aproximovaný vývoj indexu
Pre výpočet predĺženia na 2 násobok vývoja, teda niekde na 440-500 bodov je už potrebný superpočítač (Fugaku a pod.)
Introduction
This part is a free continuation of the articles (Riemann Hypothesis validity - Part 1, Riemann Hypothesis – Addendum 2, Guy - Robin index). Without understanding the issues of the previous parts, this part will not be sufficiently understandable for the reader.
I managed to create a program to verify the Riemann Hypothesis for sufficiently large numbers. This leads to certain consequences. The analysis shows that the Riemann Hypothesis remains controversial from the results so far. This part will not contain precise mathematical proof (in the sense of notation, form). This part will also clarify inaccuracies or errors from previous parts about the validity of the Riemann Hypothesis.
The calculation is based on Robin's theorem
https://mathworld.wolfram.com/RobinsTheorem.html
Validity of Riemann Hypothesis - Program
Fig. 1 Sample of program source code.
Version No.2:
download Python file: riemanm_hypothesis_1.py
View code in ".txt" format:
riemanm_hypothesis_1.txt
or download code from GitHub:
riemanm_hypothesis_1.py
Description: The algorithm contains calculation of Guy Robin index for various sequences, progressions, for confirming the validity of the Riemann Hypothesis.
Sequence of Prime Numbers in Product
1) Guy Robin calculation procedure for sequence: N=p(1)*p(2)*p(3)...p(i); p(i)=2,3,5,7 ...; p(i) ∈ prime numbers.
Results:
- given sequence up to N= 25 (see Fig.2).
Fig. 2 Sequence progression "1".
progression chart:
Fig.3
Chart of progression "1".
Sequence of Natural Numbers in Product
2) Guy Robin calculation procedure for sequence: N=p(1)^a*p(2)^b*p(3)^c...p(i)^1; p(i)=2,3,5,7 ...; p(i) ∈ prime numbers, a,b,c ∈ N; a>b>c; example N=2*3*4*5*6...
Results:
- given sequence up to N= 100 (see link: sequence_2_100_.txt).
progression chart:
Fig.4
Chart of progression "2".
Ideal Pattern
This ideal pattern, sequence is fully programmed and partially optimized. This pattern arises from the most advantageous combination of the previous two patterns.
In the validity of Riemann Hypothesis -Part 2 there is an error that there are two such ideal sequences. But there is only one.
3) Guy Robin calculation procedure for ideal sequence.
Results:
- given sequence up to N= 220, (see link: sequence_3_200_.txt).
Fig.5-6 Ideal sequence, progression of numbers - "3".
The last member has value:
[211584826248507963091268461931364601928913607488000,1.7487485890698855]
Evaluation:
From the evaluated sample of ideal sequence of numbers it seems that
the progression has an ascending character from a certain moment, numbers. This is quite
surprising.
Function Limit, Sequence
The important conclusion is this: The two mentioned sequences "1" and "2" have natural decline for n => approaching infinity. This is proven by data and charts. The ideal pattern, sequence is however ONLY the most advantageous combination of sequences "1" and "2". That ideal pattern maximizes the Gay Robin index, i.e., it concerns numbers that have the highest values.
The program confirmed this decline on a certain countable set for sequences (1),(2). The
properties of this set, i.e., the calculation of sigma (all combinations of divisors) hold for n
=> infinity, these properties do not change in any way towards infinity, the denominator in the
relation:
σ(n)/(n*ln(ln(n))) < e^γ
e^γ = 1.781072417990197985236504103107... also does
not change in any way.
Therefore, there cannot be a transition from decline to increase of Guy Robin index towards infinity for (1), (2).
We could also approach this purely mathematically:
The result of the limit depends on beta(N). So without approximating it precisely, we cannot know whether the limit is zero or some positive number.
Conclusion
For sequence (3) - ideal pattern, however, the results do not clearly indicate a decreasing function! So from the computational power of ordinary PCs, nothing like sequences (1) and (2) can be said. The problem is that sequence (3) may also exhibit oscillating character at larger numbers (but it doesn't have to).
Such rough approximation is shown in the attached Figure No.7. These cases may occur:
A)
Somewhere in 2-3 times 220-240 points it will cross the critical boundary.
B) The
development will approach the critical boundary, but will never reach it (rounded curve).
Fig.7
Approximated index development
For calculation extension to 2 times the development, i.e., somewhere to 440-500 points a supercomputer is already needed (Fugaku etc.)